
Reading the Shape of the Ground
Connect spot levels, contours and ground sections, then work through gradient, interpolation and clearly bounded cut-and-fill area examples.
Height begins with a reference
Lengths describe distances. Levels describe heights relative to a reference. That reference is a datum. Without it, a level such as one hundred point six metres is incomplete information. One hundred point six metres above what?
Some records use the Australian Height Datum, usually shortened to AHD. Geoscience Australia identifies it as Australia's national vertical datum. Other drawings may use a local project datum. These references cannot be exchanged merely because both produce numbers followed by metres.
Our example uses an arbitrary project datum. It has no connection to a real property or to AHD. Its levels are chosen to make the relationships easy to follow. The reference is fictional; the arithmetic is ordinary geometry.
Imagine a rectangular patch of ground twelve metres long and eight metres wide. Along its length, the ground rises steadily. At the low end its level is one hundred point zero zero metres. At the high end its level is one hundred and one point two zero metres.
Subtracting the low level from the high level gives a rise of one point two metres. The horizontal distance between the ends is twelve metres. Dividing the rise by the horizontal distance gives zero point one. Expressed as a percentage, the gradient is ten per cent.
The same relationship can be described as a rise of one metre for every ten metres horizontally. A ten per cent gradient is not a ten-degree angle. Percentage and degrees are different ways of describing slope. The number cannot move from one system to the other without conversion.
Our example also assumes no rise across the eight-metre width. Every point at the low end has the same level. Every point at the high end has the same level. Real ground is rarely this cooperative. We have made a simple surface so that the effect of each assumption can be seen.
From spot levels to contours
A spot level gives the height of a particular point. A contour joins points at the same level. One identifies a measurement location; the other describes a relationship across a surface.
Known levels and an assumed surface
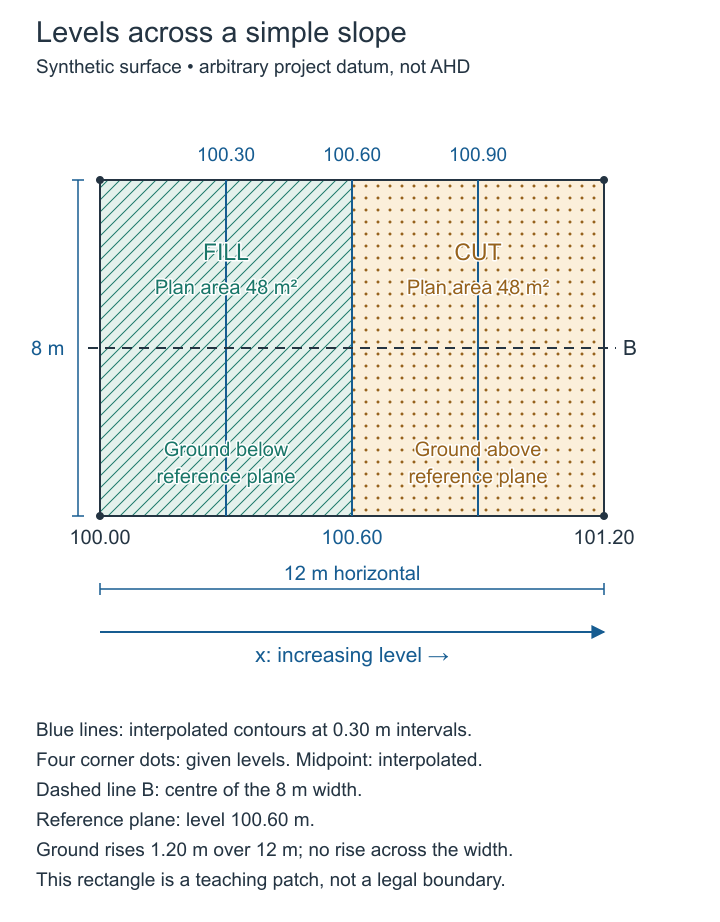
An imaginary twelve-by-eight-metre site with four known corner levels and contours drawn from one assumption.
- Observe
- Find the four corner levels first; only those are data. Then follow the contour lines drawn between them.
- Interpret
- Contours between known points are an interpretation of the surface, so the assumption behind them belongs with the drawing.
- Do not infer
- Do not treat the datum as AHD, the contours as surveyed, or the shaded areas as excavation volumes.
- Try next
- Ask what the contours would look like if the surface were not uniform.
Sources and limits for this figure
Twelve-by-eight-metre fictional site plan with corner levels, straight contours and a central section line.
Only the four corner levels are the starting data: both left corners are 100.00 metres and both right corners are 101.20 metres. The datum is arbitrary, not AHD. The teaching assumption is a uniform surface rising only from left to right.
With that assumption, the 100.30 contour is three metres from the left; 100.60 is six metres from the left; 100.90 is nine metres from the left. The contour interval is 0.30 metres.
The proposed reference plane is 100.60 metres. Its division produces two plan areas of 48 square metres each: fill on the lower half and cut on the higher half. These are horizontal areas, not excavation volumes. Section B follows the marked centre line across the twelve-metre length.
Original fictional teaching geometry — Created for this Fieldbook. Diagram conventions are stated locally; these are not surveyed or construction documents.
Source and rights:Original fictional teaching geometry
Created for this Fieldbook. Diagram conventions are stated locally; these are not surveyed or construction documents.
Suppose we know the levels at both ends of our twelve-metre line. To locate the level halfway between them, we need a model of what happens between those points. In this example, we have explicitly assumed a straight, uniform slope.
The total rise is one point two metres. Half of that rise is zero point six metres. Adding it to the low level gives one hundred point six metres. Under the uniform-slope assumption, this level occurs halfway along the line, six metres from the low end.
Finding an intermediate value between known values is interpolation. The calculation does not discover an otherwise unseen hollow or ridge. It estimates the intermediate value according to the relationship we have assumed.
Consider a second contour at one hundred point three metres. It is zero point three metres above the low end. That is one quarter of the total one-point-two-metre rise. On our uniform slope, it lies one quarter of the twelve-metre horizontal distance from the low end. One quarter of twelve is three metres.
The level one hundred point nine metres lies three quarters of the way up the rise. It therefore occurs nine metres from the low end. We now have contours at three, six and nine metres along the patch.
Because our ground does not rise across its width, each contour runs straight across the eight-metre patch. The contour spacing is uniform because the slope is uniform. In more varied ground, closely spaced contours indicate a greater change of height over a short horizontal distance, provided the contour interval stays the same.
That final condition matters. Two maps with different contour intervals can show different spacing without representing different slopes. Read the interval and the horizontal scale together. One graphical pattern cannot be interpreted in isolation from the drawing's conventions.
The companion plan, Levels Across a Simple Slope, places known points and interpolated contours on the same surface. It identifies the direction of increasing level and the line used for the section. These are explanatory coordinates, not a surveyed bearing or a legal property boundary.
Now imagine that the actual ground contains a shallow depression midway between the measured endpoints. A straight line between the endpoint levels would miss it. Additional observations would change the model. Correct interpolation from inadequate information can still give an inadequate description of a site.
For design work, this is a reason to examine the source survey and its limitations. It is not a reason to abandon calculation. Calculation helps reveal what follows from the available information. Professional interpretation also asks whether that information is suitable for the decision being made.
The ground in section
The site plan locates the levels across the patch. A section helps us understand their vertical relationship. Cut through the centre of the patch, along its twelve-metre length. In section, the uniform ground becomes a straight line rising from the low end to the high end.
The same site in section
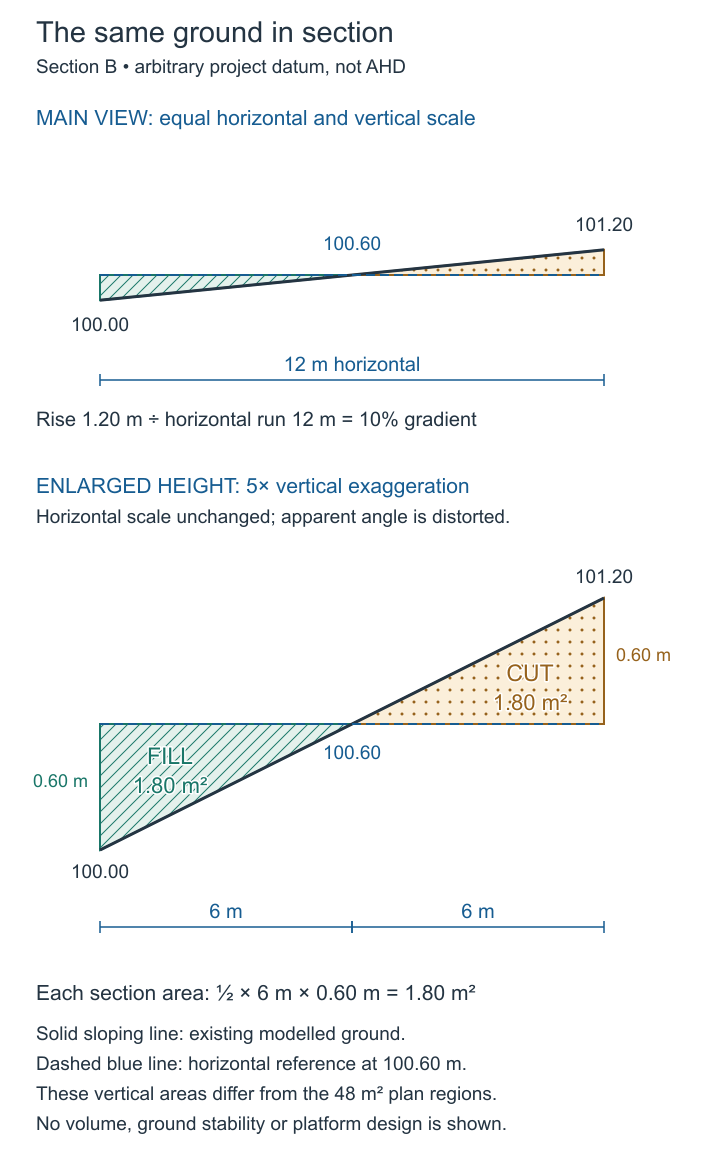
The same imaginary site cut through the middle and drawn as a ground section.
- Observe
- Compare the true-scale section with the labelled five-times-vertical enlargement below it.
- Interpret
- A ten per cent slope looks gentle at true scale; exaggerating the vertical scale makes small differences readable but changes the apparent steepness.
- Do not infer
- Do not read the enlargement as the real profile, and do not take soil behaviour or excavation stability from either drawing.
- Try next
- Work out the rise over a ten-metre run at the same slope before reading the labels.
Sources and limits for this figure
Matching ground section showing a 1.2-metre rise over twelve metres, with equal cut and fill triangles relative to level 100.60.
The main section uses equal horizontal and vertical scales. Rise is 1.20 metres over a horizontal run of twelve metres: ten per cent, or one in ten. Ten per cent is not ten degrees.
The reference level crosses the straight surface halfway along. Each shaded section triangle has a six-metre base and 0.60-metre maximum height. Half multiplied by six multiplied by 0.60 gives 1.80 square metres.
The enlargement uses five times the vertical scale and is explicitly labelled. It makes the triangles easier to see but exaggerates apparent steepness. No soil behaviour, excavation stability, bulking or construction volume is determined by this exercise.
Original fictional teaching geometry — Created for this Fieldbook. Diagram conventions are stated locally; these are not surveyed or construction documents.
Source and rights:Original fictional teaching geometry
Created for this Fieldbook. Diagram conventions are stated locally; these are not surveyed or construction documents.
Introduce a horizontal reference plane at one hundred point six metres. This is a hypothetical comparison level, not an approved building platform. It intersects the existing ground halfway along the section, at six metres.
Towards the low end, the reference plane sits above the ground. The difference is greatest at the end, where it is zero point six metres. Towards the high end, the reference plane sits below the ground. There, the maximum difference is also zero point six metres.
If ground were brought to this reference plane, the low half would require filling and the high half would require cutting. These words describe the direction of the level change. They do not establish that the proposed change is permissible, stable or suitable for a building.
The companion section shows the existing ground, the reference plane and their intersection. It uses equal horizontal and vertical scales in its main view. This keeps the slope's apparent angle consistent with the stated geometry. A separate enlargement of the shallow difference makes the two triangular areas easier to inspect, and is labelled with its vertical exaggeration.
Vertical exaggeration is useful when a small height difference would otherwise disappear on a long section. It also changes the apparent steepness. A section that stretches height more than distance must tell the reader that it has done so. Otherwise the picture encourages a false impression even if its level labels are correct.
Two different kinds of area
In plan, our reference plane divides the rectangular patch into two equal halves. Each half is six metres long and eight metres wide. Multiplying six by eight gives forty-eight square metres. The plan area requiring a level increase is forty-eight square metres. The plan area requiring a level reduction is also forty-eight square metres.
These areas describe the horizontal extent of the two regions. They do not tell us how deep the cut or fill would be throughout either region. On our example slope, the difference changes continuously from zero at the intersection to zero point six metres at an end.
In section, each difference region is triangular. Its base is six metres. Its greatest height is zero point six metres. The area of a triangle is half its base multiplied by its perpendicular height. Half of six multiplied by zero point six gives one point eight square metres.
We therefore have a fill difference area of one point eight square metres in this section, and an equal cut difference area. These are vertical sectional areas. They are not the forty-eight-square-metre plan areas, even though both kinds of area are expressed in square metres.
The distinction is about the surface being measured. A floor area and a wall area can both use square metres while describing different things. Plan and section areas behave in the same way. The unit tells you that the quantity is an area. The drawing and its label tell you which area.
An earthworks volume would require a further three-dimensional model. On real sites, material behaviour and construction requirements introduce additional considerations. Equal geometric cut and fill does not by itself establish a balanced earthworks operation. Nothing in our simple calculation specifies compaction, soil suitability or how the edges would be supported.
The value of the example is the connection it makes. Spot levels establish known heights. An explicit model supports interpolation. Contours locate equal heights in plan. A section reveals vertical differences. Calculated areas then describe particular regions on particular planes.
Each step depends on the previous one remaining identifiable. If the datum changes without being recorded, the numbers lose their relationship. If a drawing is rescaled without notice, a measured distance can become misleading. If an interpolated line is treated as a direct observation, certainty is overstated.
A careful reader moves between numbers, pictures and source records. The aim is more than arriving at a tidy answer. It is understanding what the answer describes, how it was obtained and which further decisions it can reasonably support.
When the contours stop being parallel
Our straight contours belong to an unusually simple surface. A real contour can curve around a slope, pass through a valley or close around a high or low area. Its shape becomes meaningful when read with neighbouring contours and their level labels.
Imagine three closed lines on a plan. If the labelled levels increase towards the centre, the represented surface rises inward. If they decrease, the interpretation changes. Shape alone is insufficient; the values and drawing conventions distinguish the two situations.
Likewise, a cluster of close contour lines can suggest a steeper region than nearby widely spaced lines. That comparison assumes the same contour interval and horizontal scale. If one part of a record uses a different convention, the apparent contrast needs to be examined again.
A contour does not normally mark a constructed edge. Walking across an ordinary slope, you do not encounter a step at each contour line. The line is a representation of equal height on a continuous surface. A retaining wall, kerb or other abrupt change requires its own representation and information.
This distinction prevents a misleading mental picture of terrain as a stack of flat terraces. Contours help describe the ground, but the lines themselves are not physical ridges. Model-making sometimes exaggerates this impression when contour layers are left as visible steps.
The extent of the survey also matters. A line stopping at the edge of a drawing may stop because the recorded area ends. It does not necessarily indicate that a ridge, drain or slope ends there. Conditions beyond the site can still influence what happens within it.
When contour spacing changes
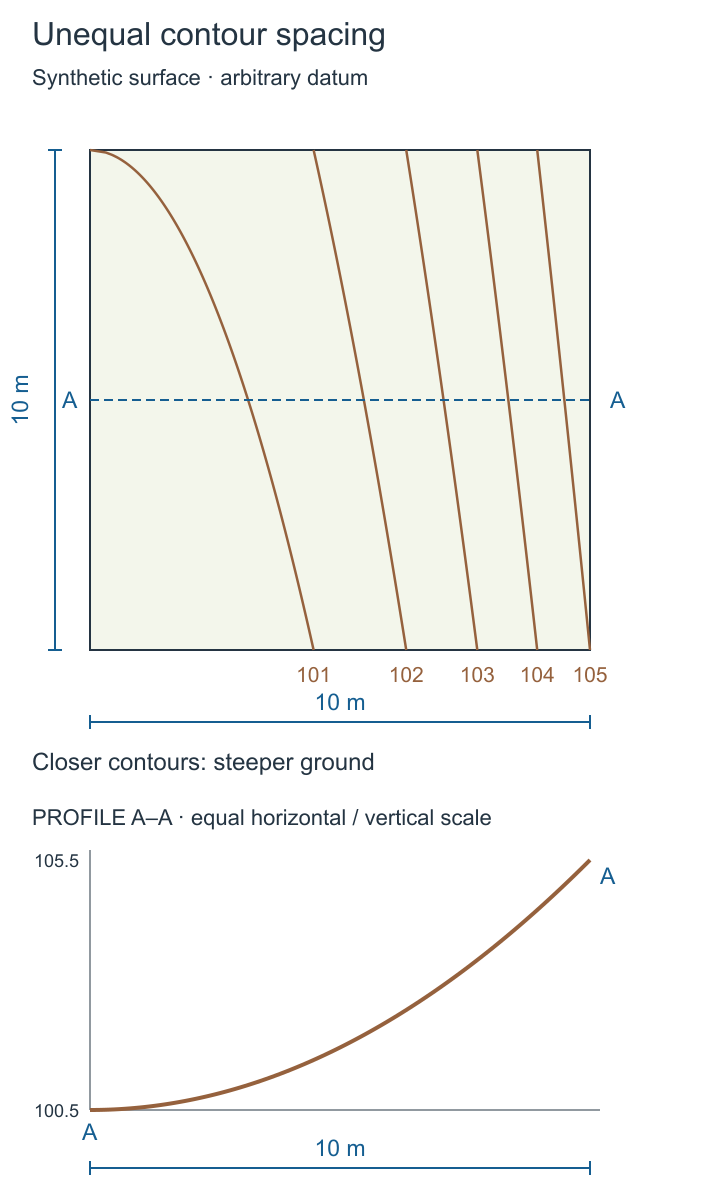
A second companion shows a fictional curved surface rather than the earlier uniform slope. Each successive contour represents one metre of height. On this model the contours become closer together towards the right, where the surface becomes steeper. The changing spacing communicates changing gradient.
Curved contours and a matching profile
Imaginary curved contours and the matching ground profile taken along one line.
- Observe
- Find where the contour spacing tightens, then find the same position on the profile beneath.
- Interpret
- Spacing is the readable signal of slope: close contours mean a steeper surface along that line.
- Do not infer
- Do not read the curvature as a survey of real ground or the profile as a design level.
- Try next
- Choose a second line across the contours and sketch the profile you would expect.
Sources and limits for this figure
Fictional curved terrain contours above a curved section along the plan’s middle.
The complete mathematical model is z = 100 + 0.05x² + 0.1y, with x and y measured in metres from zero to ten. In plan, x increases rightwards and y upwards from the lower-left corner. All contours and the section come from this declared surface, not from four measured corners.
The contour interval is one metre. The marked section follows y = 5 metres, giving z = 100.5 + 0.05x². Its endpoints are 100.5 and 105.5 metres, and its midpoint at x = 5 is 101.75 metres.
The section uses equal horizontal and vertical scales. Its changing steepness corresponds to changing contour spacing. The average rise/run is five divided by ten, or fifty per cent; local gradient varies. A real site requires sufficient observations and a defensible terrain model.
Original fictional teaching geometry — Created for this Fieldbook. Diagram conventions are stated locally; these are not surveyed or construction documents.
Source and rights:Original fictional teaching geometry
Created for this Fieldbook. Diagram conventions are stated locally; these are not surveyed or construction documents.
The matching section follows the marked line through the middle of the plan. Its horizontal and vertical scales are equal. It starts at level one hundred point five and ends at one hundred and five point five, over a horizontal distance of ten metres. The curved line, rather than a straight diagonal, is the crucial difference.
A rise of five metres over ten metres gives an average gradient of fifty per cent along that whole section. It does not mean that every short part has that gradient. The line is flatter near its left end and steeper near its right end. On actual land, measurements and an appropriate terrain model would be needed to support that shape. Here the complete surface is a declared mathematical teaching model, not an interpolation claimed from four surveyed corners.
Following water without designing drainage
Differences in level influence where surface water can move under gravity. A plan can therefore help identify low areas, possible flow paths and relationships between buildings and surrounding ground. It is a starting point for asking drainage questions.
The question is more complex than drawing an arrow downhill. Kerbs, walls, channels, surface finishes and local depressions can change the path. The amount and timing of rainfall, the contributing area and the capacity of drainage systems also matter.
Suppose a site falls towards its street frontage. That broad fall does not prove that water can be discharged there or that the proposed drainage is adequate. The actual outlet, relevant authority requirements and the designed system require investigation. A topographic interpretation cannot grant permission or establish hydraulic capacity.
A photograph of dry ground has a similar limit. It records conditions at the time of the visit. It may not reveal what happens during intense rain or after prolonged wet weather. Existing drainage records, local information and specialist investigation can answer different parts of that question.
The drafter can preserve the useful observation without overstating it. A note may identify a visible low point and the nearby drainage feature. It should distinguish that observation from a confirmed account of the drainage system's operation or capacity.
Ground shape and ground behaviour
The shape of the surface does not establish what lies beneath it. Two sites with similar contours can have different soil profiles, fill histories, groundwater conditions and bearing behaviour. A level plan and a geotechnical investigation serve different purposes.
Reactive clay provides a useful example of why subsurface conditions matter. Changes in moisture can cause such ground to swell or shrink. Drainage, vegetation and leaking services can influence moisture conditions. Those effects cannot be diagnosed from contour spacing alone.
A flat site is therefore not automatically simple to build on. A sloping site is not automatically unsuitable. The relevant investigation considers the particular ground and proposed development. The design response may depend on information that a surface inspection cannot supply.
In the building-design workflow, spot levels used for developing contours need an appropriate survey source. A registered land surveyor's site survey has a defined role and scope. Supplementary observations should remain identifiable rather than being silently merged into that source as if the surveyor had recorded them.
This distinction is particularly useful when a site has changed since the survey. New earthworks or structures may make part of the old record unsuitable for the current question. The solution is to identify the change and arrange the appropriate update, not to retain a familiar drawing because it is convenient.
The scale of a conclusion
The simple slope has allowed several exact calculations because its assumptions were deliberately limited. Its ground rises uniformly, its width has no crossfall, and its reference plane is horizontal. Change any of those premises and the geometry must be reconsidered.
If the width also slopes, the contours will no longer occupy the same positions across the rectangle. If the reference plane tilts, its intersection with the ground changes. If the ground is irregular, one section may fail to represent adjacent parts of the site.
These are not minor qualifications attached to an otherwise universal answer. They explain what the calculation actually models. A result remains useful when its scope stays clear. It becomes misleading when its assumptions disappear as the number moves into another document.
The central habit is to connect every quantity with its plane, reference and source. Length, level, gradient, area and volume describe different relationships. Keeping those relationships visible allows a reader to use a drawing intelligently and recognise where further information must enter the design process.